Today’s businesses are drowning in data, but few can turn it into real insight. That’s where ERP analytics comes into play. That’s where ERP analytics comes into play. With ERP spending projected to reach $147.7 billion in 2025 and the predictive analytics segment alone expected to hit nearly $28 billion by 2034 according to the HG Insights and Market.us reports, companies are investing heavily in smarter tools. Why?
Because business leaders need better ways to plan ahead, analysts want clearer data stories, and operations teams need real-time visibility to fix issues before they escalate. Traditional reports just aren’t enough anymore. ERP analytics connects the dots between departments, reveals hidden dangers and trends, and helps you act fast. No matter if it comes to spotting a supplier issue or improving profit margins. This article shows you how.
What is ERP Analytics?
ERP analytics goes beyond basic data tracking. It connects business operations with data insights to help teams make faster, smarter decisions.
Definition and Purpose of ERP Analytics
ERP analytics is the process of examining the data captured across various modules of an ERP system — including finance, inventory, sales, procurement, HR, and production — to gain a deeper understanding of business operations. It turns raw transactional data into structured insight that supports better planning, strategy, and performance tracking.
The purpose of ERP analytics is to help companies make smarter decisions, backed by real data instead of gut feeling. It reveals what’s driving performance and where the weak spots are. Business owners, managers, and teams can answer questions like:
- Which suppliers are consistently late or overcharging?
- What’s the actual cost of production per unit, including overhead?
- Are we hitting our sales targets by region or channel?
- Which employees or teams are hitting KPIs — and which are falling behind?
This level of insight allows businesses to react faster, reduce waste, and focus on what actually drives profit.
Kladana has been instrumental in helping us streamline our operations. After nearly nine months of using the tool, one of the most rewarding moments came when we calculated our profit and launched the analytics. A standout feature in the sales module allowed us to analyze profit margins for each order.
It was amazing to see the system provide detailed insights, such as logistics percentage, gross profit (GP) ratio, and net profit ratio. This level of transparency and data accuracy was a game changer.
Difference between ERP Analytics and Standard ERP Reporting
ERP reporting shows you what’s already happened — it’s static and often limited to a specific department. Think: monthly sales reports or inventory lists.
ERP analytics looks across departments, combines multiple data sources, and reveals patterns. It enables forecasting, performance tracking, and real-time insight. In short:
- Reporting = historical snapshots
- Analytics = connected, dynamic insights
Key Features of ERP Analytics Tools
The most useful ERP analytics tools offer more than just charts and graphs. They help businesses act faster, stay informed, and plan ahead with features built to turn raw data into clear, usable insight.
Real-Time Reporting
Real-time reporting gives teams immediate access to updated business data. Instead of waiting for end-of-month summaries, users can view current inventory levels, open purchase orders, or cash flow status as they change throughout the day. This supports faster decisions — like adjusting stock levels before they run too low or flagging a production delay as it happens.
Example: A retailer sees that sales for a specific product are spiking in real time and quickly reallocates stock from underperforming stores to meet demand without missing sales opportunities.
Data Visualization Dashboards
Dashboards turn raw data into visual overviews that are easier to understand at a glance. Instead of combing through rows of numbers, users can spot issues and trends using charts, graphs, and heat maps.
Most ERP dashboards are customizable, letting users focus on the data that matters most to their role — whether that’s sales numbers, production status, or cash flow. Visual tools help identify bottlenecks, compare performance over time, and track progress against goals.
Example: A warehouse manager uses a heat map dashboard to see which zones experience the most stockouts and adjusts replenishment schedules accordingly.
Predictive Analytics and Forecasting
Predictive analytics uses historical data and algorithms to estimate what’s likely to happen next. It helps businesses forecast demand, plan budgets, and avoid overproduction or stockouts.
Example: A manufacturer reviews two years of sales and production data and predicts a 30% increase in demand during Q4. They use this insight to ramp up production ahead of time, avoiding missed sales and overtime costs.
KPI and Performance Tracking
Tracking key performance indicators (KPIs) directly inside the ERP system helps teams stay focused on results. These could include metrics like order accuracy rate, production lead time, sales per rep, or inventory turnover.
Having KPIs tied to live business data keeps performance monitoring consistent and transparent. Teams can set targets, measure progress, and act quickly if performance dips.
Example: A sales team monitors daily conversion rates and average deal size through their ERP dashboard. When they spot a sudden drop, they investigate and correct messaging issues in their outreach.
Integration with Big Data
ERP analytics tools that connect with big data platforms can process much larger and more complex datasets — from customer behavior logs to supplier lead time stats. This expands the scope of analysis and makes predictions more reliable.
Example: A fashion brand integrates weather data with its ERP system and finds that rain forecasts reduce in-store traffic by 20%. They adjust local promotions and staffing in response to improved efficiency and sales.
Kladana helped Artisanté, chocolate & coffee manufacturer, to streamline production & purchasing flow in half a year.
With Kladana, Artisanté streamlined its entire manufacturing process. Production operations became more organized, and planning and purchasing raw materials turned into a much simpler task. Now, the purchasing manager can open a single screen in Kladana, view sales estimates, calculate the required quantity of raw materials for various products, and instantly create purchase orders.
Kladana’s analytics features also help the team track raw material wastage, calculate staff wages, identify excess usage during production, and gain other valuable insights to improve operations.
Benefits of ERP Analytics
ERP analytics doesn’t just organize information — it helps businesses operate more efficiently, spot risks earlier, and understand performance with more accuracy. Here’s how the right analytics setup can directly impact day-to-day decisions and long-term results.
Smarter Decision-Making with Centralized Data
When all departments feed into one ERP system, data becomes a shared resource instead of being scattered across spreadsheets or siloed tools. Analytics tools pull from this unified source to give leaders a complete, accurate view of the business.
Example: A business owner comparing sales performance and inventory levels across multiple locations can decide where to shift stock or scale marketing — without waiting for individual updates from each team.
Early Detection of Inefficiencies
ERP analytics helps identify performance gaps before they turn into costly problems. By tracking metrics like production cycle time or procurement delays, teams can spot issues early and take action before they escalate.
Example: A production manager sees that one assembly line consistently falls behind. After checking analytics, they discover that delayed component deliveries are the cause and switch to a more reliable supplier.
Enhanced Forecasting and Budgeting
Accurate forecasts require more than past sales numbers. ERP analytics combines sales, inventory, and financial data to produce detailed forecasts that account for seasonal demand, supplier lead times, and cash flow trends.
Example: A CFO uses ERP analytics to predict revenue for the next quarter based on sales trends, then adjusts the budget for hiring and marketing to stay within projected cash flow limits.
Improved Customer Insights and Sales Performance
ERP systems that track customer orders, returns, and communication history can feed that data into analytics dashboards. This helps businesses better understand customer behavior and fine-tune their sales strategies.
Example: A sales manager analyzes buying patterns and discovers that repeat customers tend to purchase within 30 days of their last order. They set up an automated reminder campaign to boost retention and increase revenue.
Kladana is the perfect software for inventory management. Implementing it comes down to pretty much the fact that you just sign up in the app — and you’re ready to go. In addition, Kladana has a convenient CRM.
It provides analytics on each customer — their purchase history, average check, favourite products & comments. It allows you to segment customers and scrutinize reports by clients and sales orders.
Naturally, we took advantage of all these features when working with private clients. We assigned customers different statuses, started writing to them, and reminded them of our products.
We work entirely in Kladana. When we receive a new sales order, we process it, send the customer a payment link, and arrange delivery. We can also see what else the customer has bought, and what items were in their previous orders.
ERP Big Data and Advanced Business Analytics
As businesses collect more data than ever before, ERP systems have evolved to not just store it, but to help make sense of it. Big data capabilities open the door to more advanced, strategic analysis.
Role of Big Data in ERP Systems
Big data expands what ERP systems can analyze. By handling high volumes of structured and unstructured data — from machine logs to customer feedback — ERP platforms gain deeper insight into operations, market behavior, and supply chain dynamics. This allows businesses to spot patterns across millions of data points, not just daily transactions.
Examples of How Large Datasets Are Analyzed in ERP Environments
A manufacturing company might combine IoT sensor data with ERP analytics to monitor equipment efficiency in real time. A retailer could merge customer purchase history and web behavior to personalize offers. The value lies in scale — more data leads to better analysis.
ERP Reporting vs ERP Analytics
Though often used together, reporting and analytics serve different needs in an ERP system. Understanding when to use each can improve clarity and decision-making.
Key Differences and Use Cases for Each
ERP reporting is about documenting facts — it shows what happened. It’s useful for audits, compliance, and day-to-day summaries. Analytics explores patterns and relationships in the data to explain why something happened and what’s likely to happen next.
When to Use Dashboards vs Reports
Use dashboards for quick insights, live metrics, and high-level monitoring. They’re ideal for operational roles where fast decisions are needed — like tracking sales performance or daily production status.
Reports, on the other hand, are better for detailed analysis, historical records, and presenting structured data to stakeholders. Use them for monthly financial reviews, vendor performance evaluations, or regulatory reporting.
Best ERP Analytics Tools
Not all ERP systems offer the same level of analytics. Some focus on core operations, while others include built-in tools for advanced reporting, forecasting, and data visualization.
Overview of Leading ERP Systems with Strong Analytics Capabilities
Popular platforms are known for their analytics features. They often include customizable dashboards, predictive models, multi-source data consolidation, and AI-driven insights. For companies that need full visibility into operations, they offer scalable solutions across departments. Let’s explore several of them.
Kladana
Kladana, built for small and mid-sized businesses, combines practical analytics with a clean interface. It supports real-time reporting, stock tracking, sales analysis, and integrates with tools for added CRM and accounting insights — giving growing businesses better control without the complexity.
Here you can explore the key analytical reports available in Kladana.
The Profit report offers a detailed summary of your sales performance, including key metrics like Gross Sales, Cost of Goods Sold (COGS), and Profit for a selected period. It helps you pinpoint the most profitable products in your catalog. The report is generated based on Sales and Shipments data.
You can generate the report using one of the following filters:
- By Products — Analyze which products are bringing in profit or loss within a chosen time range.
- By Employees — See how much revenue and profit each team member generates, helping with professional fee calculation.
- By Customers — Understand which customers contribute the most to your revenue and explore why they’re profitable.
- By Sales Channels — Compare the profitability of different sales channels you’re using.

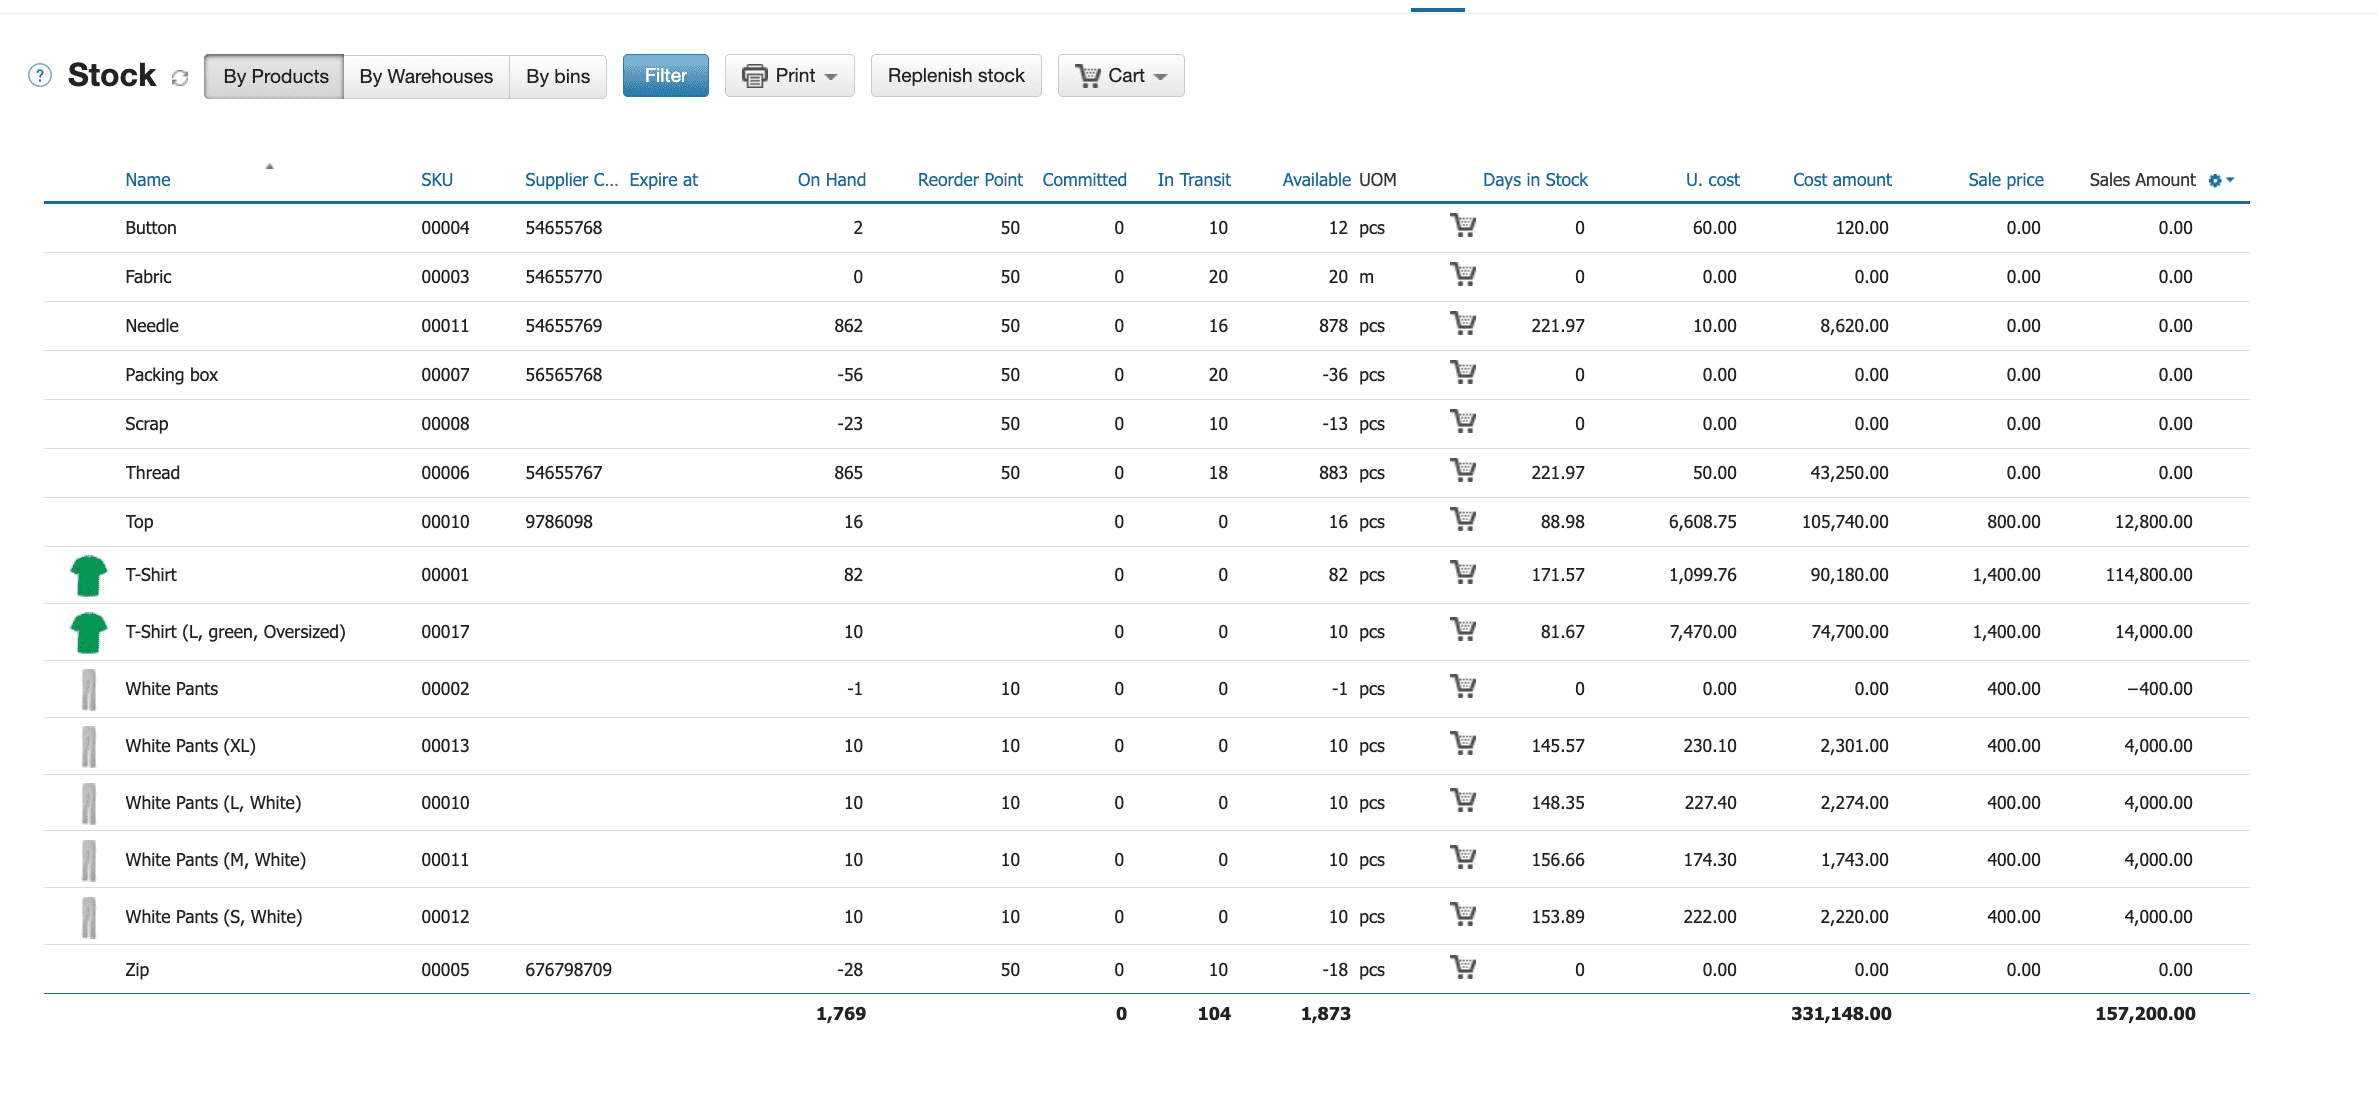
The report displays the stock levels of all products across all warehouses for the selected time period. It provides detailed information on the total quantity in stock and the overall inventory value.

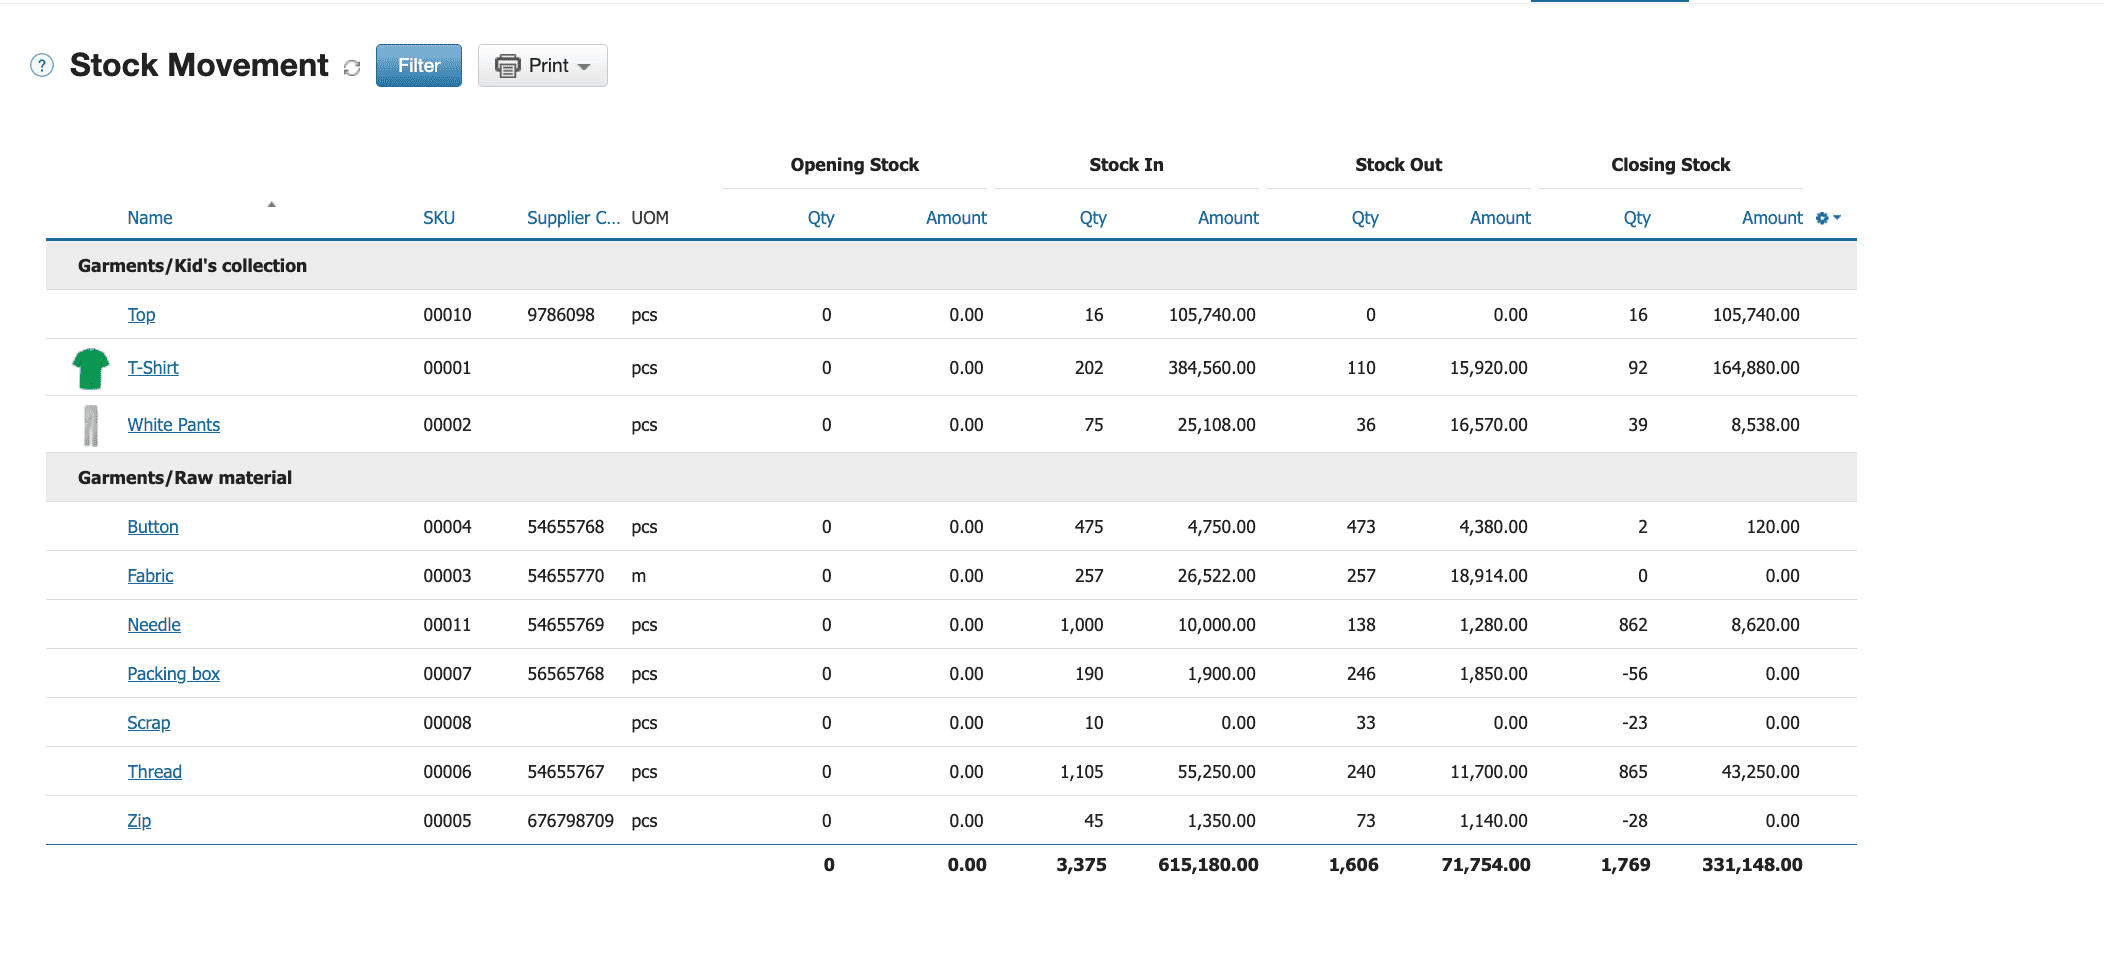
The report helps you monitor product movements within the warehouse over a selected time period. It also provides statistics filtered by warehouse, counterparty, or project.

It displays all product items currently in production, including the completed quantity, current status, last finished stage, time spent in production, and the volume of work-in-progress.

SAP S/4HANA
SAP S/4HANA is a cloud-based ERP system that integrates real-time analytics, AI, and machine learning to provide live insights into finance and supply chain processes. Its embedded analytics enable scenario simulations, cross-departmental planning, and predictive modeling, facilitating agile and informed decision-making.
Oracle NetSuite
Oracle NetSuite offers a unified cloud ERP solution featuring SuiteAnalytics, which includes real-time dashboards, KPI tracking, and customizable reports. Its Analytics Warehouse consolidates data from various sources, allowing for comprehensive analysis and data-driven decisions across the organization.
Microsoft Dynamics 365
Microsoft Dynamics 365 combines ERP and CRM capabilities with AI-powered analytics to deliver real-time insights across finance, sales, and operations. Features like Copilot assist in data exploration, while embedded analytics support proactive decision-making and performance monitoring.
Odoo
Odoo is an open-source ERP platform that offers integrated analytics across its suite of business applications, including CRM, accounting, and inventory. Its analytic accounting tools help track costs and revenues, providing insights into project profitability and operational efficiency.
Key Features to Look for in ERP Analytics Platforms
When choosing an ERP with strong analytics, look for tools that offer:
- Real-time reporting — access to live data for quick decision-making
- Customizable dashboards — tailored views for different departments or roles
- Advanced forecasting — tools that predict trends based on historical data
- KPI tracking — the ability to monitor key metrics in real time
- Big data integration — support for external sources like market or sensor data
- Automation features — scheduled reports, alerts, and rule-based notifications
- User role permissions — control over who sees what based on access levels
- Scalability — features that grow with your business and adapt to new needs
- Compatibility with your stack — easy integration with CRM, accounting, or e-commerce platforms
Summary
ERP analytics helps businesses turn raw data into clear insights for smarter decision-making. Unlike standard reports, it tracks performance trends, forecasts demand, and identifies inefficiencies across departments. Features like real-time reporting, dashboards, and big data integration make it easier to manage operations and plan ahead. ERP analytics supports better inventory control, sales strategy, and budgeting — all from a single platform.
Kladana has helped us to build good relationships with our customers. And thanks to the analytics and reports in the app, we found out that about 70% of our customers were regular clients. One of them bought $15,000 worth of oysters from us. Over several years, it’s true, but still.
Frequently Asked Questions on ERP Analytics
What is the role of analytics in ERP?
ERP analytics helps businesses make informed decisions by turning operational data into actionable insights. It shows trends, tracks performance, and uncovers areas for improvement.
How do ERP analytics improve forecasting?
By analyzing historical data like sales patterns, inventory movements, and seasonal demand, ERP analytics helps create more accurate forecasts and supports better planning.
Is ERP analytics only for large enterprises?
No. Small and mid-sized businesses benefit from ERP analytics too — especially when they need to optimize resources, improve efficiency, or scale operations with data-driven decisions.
How does ERP analytics support inventory management?
It helps track stock levels, turnover rates, and supplier performance, making it easier to avoid overstocking or stockouts and improve procurement planning.
Can ERP analytics replace a separate BI tool?
In many cases, yes — especially for businesses using modern ERP systems with built-in dashboards, reporting, and forecasting tools that cover most analytical needs.
List of Resources
- Market.us — Global Predictive Analytics in ERP Market Size, Share, Statistics Analysis Report By Component (Solution, Services), By Deployment (Cloud-based, On-premise), By Enterprise Size (SMEs, Large Enterprise), By Application (Manufacturing, Retail, Financial Management, Supply Chain Management (SCM), Others), Region and Companies — Industry Segment Outlook, Market Assessment, Competition Scenario, Trends and Forecast 2025-2034
- HG Insights — ERP Market Share, Size & Key Players in 2025


