Many companies start with high hopes but struggle when they lack clear insights into day-to-day tasks. According to the U.S. Bureau of Labor Statistics (BLS) around 20% of new businesses close in the first year, and that figure reaches 50% by the fifth year.
Why so?
The most common reason is confusion about business operations, which can lead to poor planning and missed targets.
Better data tracking can stop these challenges from growing out of control. You’d also need to leverage clear operational reporting to spot issues early, as it can illuminate ways to boost revenue.
As we move forward, we will look at how a well-structured operation report can help shape goals, guide decisions, and keep a team on track.
- What are Business Operations?
- What is Operational Reporting?
- Meaning of Business Operations Report and Its Contents
- Operational Reporting Examples With Templates
- Types of Business Operations Report
- Analytical Reporting vs Operational Reporting
- Benefits of Using Business Operations Reporting
- FAQs on Business Operations Reporting
What are Business Operations?
Business operations cover the core tasks that keep a company moving each day. Operational reporting organizes data around those tasks, which helps teams spot trends and make quick decisions.
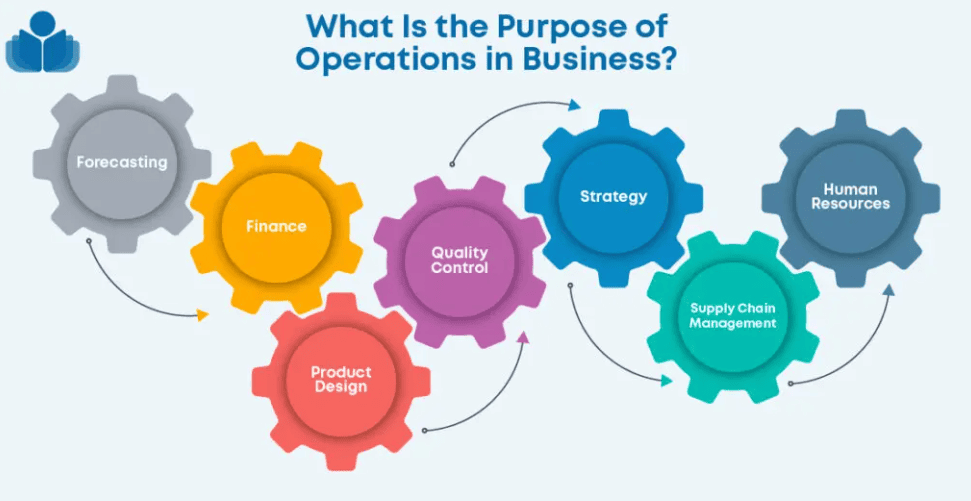
Some call it operations reporting or an operation report, but they all answer one core question: what is operational reporting, and how does it help? The simple answer is that it tracks daily progress in real-time. That includes production rates, sales figures, or any other function that measures how well the company runs.
When you look at operational reporting examples, you see patterns in costs, timelines, and team performance.
An operations report template can speed up the process of data collection and presentation. In many firms, this is known as a business operation report or an operating report. Each name points to the same idea: show the real story behind the day’s work.
Streamline your manufacturing processes, minimize downtime, and cut costs with Kladana. Manage your inventory and automate sales.
What is Operational Reporting?
Operational reporting allows you to access real-time data on everyday tasks within business operations. You don’t need to wait for weekly or monthly summaries. Instead, operational reporting allows you quick updates on production, sales, or service output.
A typical report dashboard would look like this.
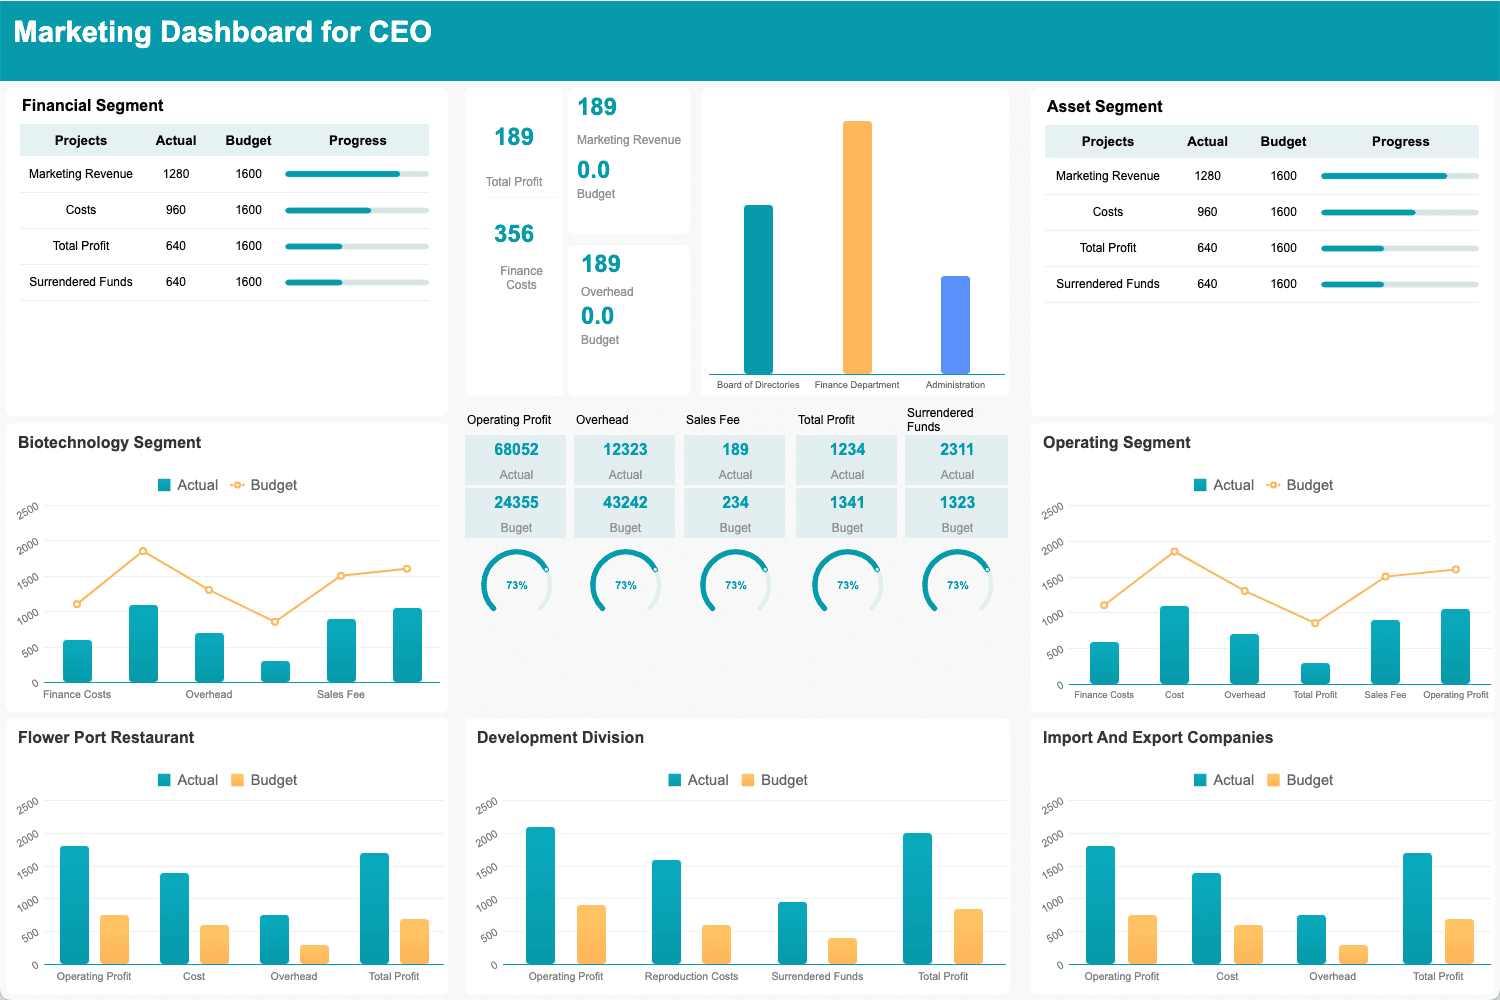
Ultimately, the top leaders can leverage the operational reporting to react fast and keep all processes on track.
| Characteristics | Description |
Should offer real-time insights |
The business operations report must show up-to-the-minute figures that highlight emerging issues before they grow. |
Must be pivoted to reporting day-to-day tasks |
The reports must be capable enough to help key decision-makers and executives track activities like daily output or open tickets, which helps refine each operation report. |
Making decisions based on data |
Different teams across organizations must have access to the business operations report templates to create one and use it to pinpoint weak links and sort them out. |
Possess granular detail |
You must be able to create a comprehensive business operations report to provide a closer look at each step of an operation management report for better clarity. |
Crafted with keeping actions at the center |
The report must be able to encourage immediate fixes so you don’t wait for long-term reviews |
Meaning of Business Operations Report and Its Contents
A business operation report will contain crucial information that captures core tasks driving an organization’s routine progress. It ties each stage of work to measurable outcomes so that managers can see both successes and trouble spots at a glance.
Below, we’ll explore the major contents of the business operations report. Let’s find out.
1. Title
It’ll have the name of your operations report. Keep it concise and in a way that reflects the main objective or time frame you’re covering.
2. Date and Time
Mentions when the operation report was created. With precise details, you can help readers track any change or progress over specific days or hours.
3. Executive Summary
A short overview of the entire business operation report. Touch on key data, achievements, and action points to give top-level clarity.
4. Key Performance Indicators (KPIs)
These numbers reveal the health of daily tasks. They can include sales, production speed, or other markers of success in operational reporting.
5. Operational Processes
Summarize the steps involved in daily operation reporting. For instance, this might outline order handling, product assembly, or service delivery flow.
6. Operational Highlights
Pinpoint standout progress or milestones within the report operation. This can spotlight wins that show up in operational reporting examples.
7. Challenges and Issues
Share any roadblocks affecting workflow. Whether it’s resource gaps or missed deadlines, listing them here can spark quick fixes.
8. Resource Allocation
Outline how materials, funds, or staff are used. This segment in a business operation report offers insight into whether resources are stretched too thin or used effectively.
9. Risk Assessment and Mitigation
Identify threats that could derail tasks and note ways to reduce them. This will help prevent surprises that could harm daily operation report outcomes.
10. Stakeholder Engagement
Show which groups or individuals are directly involved. This might include clients, vendors, or top-level teams tracking what an operating report is.
11. Future Plans and Recommendations
Based on the data, suggest the next steps. These could include new metrics to add to your operations management report or steps to improve workflows.
12. Conclusion
Close with a brief summary of the data’s implications for current performance. This section ties the findings together into a simple final note for the reader.
13. Appendices
Include extra data, charts, or references. For instance, a daily operation report format or an operation report template might appear here for those who need more detail.
Operational Reporting Examples With Templates
Real-life formats of operational reports can speed up your path to finding better insights.
Below, we’re providing five common reporting examples and templates to simplify preparing the same and share results with team members.
Production Reporting
You can use the operational reporting for production, which tracks items produced, the speed of output, and any snags that might slow the line. Precise data here means quick fixes before delays pile up.
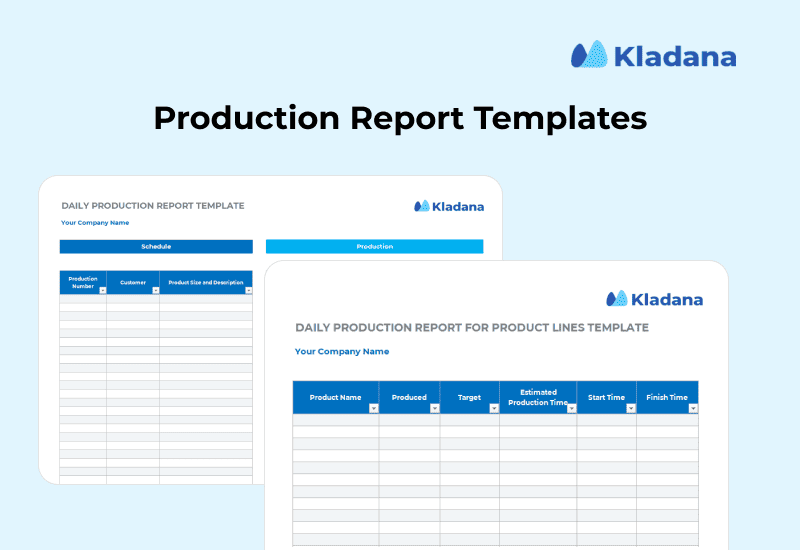
There are multiple types of daily production reports to track progress — from simple to assembly line and product line.
We have prepared templates for five different use cases (navigate sheets in the shared file):
1. Daily Production Report
2. Daily Production Report — Department Wise
3. Daily Production Report for Assembly Lines
4. Daily Production Report for Product Lines
5. Daily Production and Assembly Report With Shipment Details
Here’s a single Excel file to download all of them. Alternatively, you can create a copy in Google Sheets and use it natively.
Inventory Management Reporting
This will focus on stock levels, turnover rates, and reorder points in operational reporting to prevent overstocking or stockouts. Timely insights keep storage costs in check and fulfill customer demand with ease.
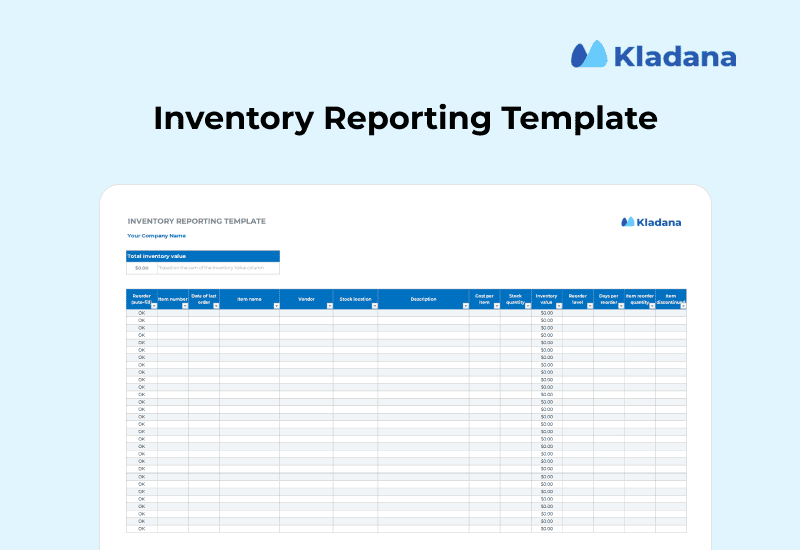
For starters, you can follow the steps we’ve mentioned to create an inventory management report in Excel.
Alternatively, you can download the inventory reporting template, which includes two sheets — one with sample data and one without — for a clearer understanding.
Download it in Excel or you can even use it with Google Sheets.
Sales Reporting
It’s a type of reporting that looks at deals closed, leads generated, or revenue by product line. A sales report will show which areas need extra focus or training so that businesses can shape targets for the next cycle, aligning daily operation report formats with broader goals.
Access sales report templates in Excel, Word, Google Sheets, and PDF from the link below:
Get daily, weekly, and monthly sales report templates in multiple file formats
Financial Reporting
This one zooms in on expenses, profit margins, and cash flow. This is often a key part of operational reporting vs. management reporting, as leaders can track crucial finances. When shared in an operation management report, it can steer budget decisions and future investments.
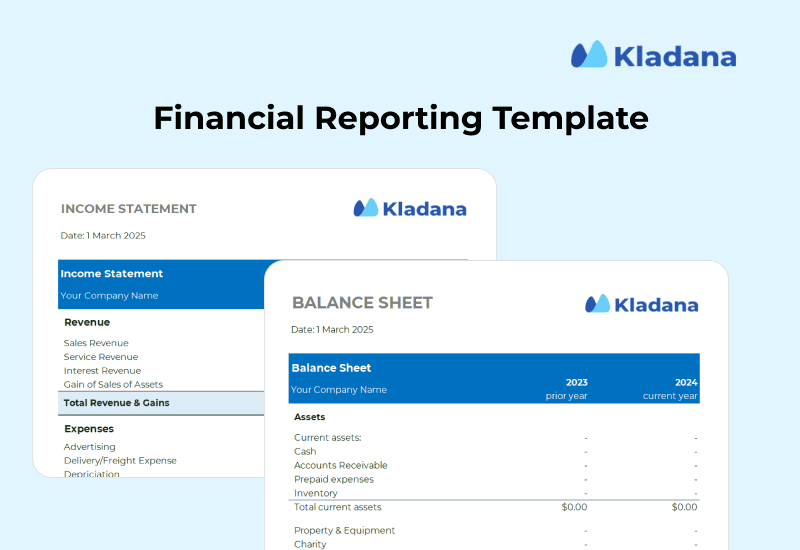
Be it a Balance Sheet or Income Statement, we’ve got you covered.
Below, we’re providing the templates for the balance sheet, income statement, and even cashflow statement.
You can download it in MS Excel or create a copy in Google Sheets.
Balance Sheet |
||
Income Statement |
||
Cash Flow Statement |
Customer Service Reporting
Review open tickets, resolution times, and satisfaction scores. This offers a window into how well a team handles support since you get the essential details in an operation report sample or a weekly business operation report. It’s how teams can spot gaps and respond faster to client needs.
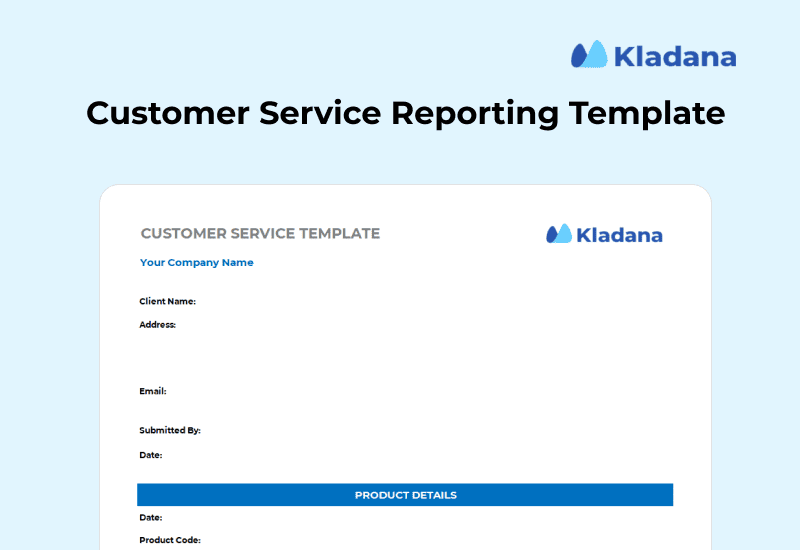
Leverage the customer service reporting template we’ve created in the MS Excel format to get started. Alternatively, you can create a copy in Google Sheets.
Types of Business Operations Report
Different tasks will require different views. That’s why businesses use various types of operations reports to keep track of their work.
Each report serves a unique purpose, helping teams understand progress, spot gaps, or plan ahead. Now, this can be for regular updates, deep analysis, or answers to specific questions; having the right type of report ensures that no important detail slips through the cracks.
Daily/Weekly/Monthly Reports
As a part of reporting, the activities that focus on every ins and outs of the business find their place in these types of business operations reports.
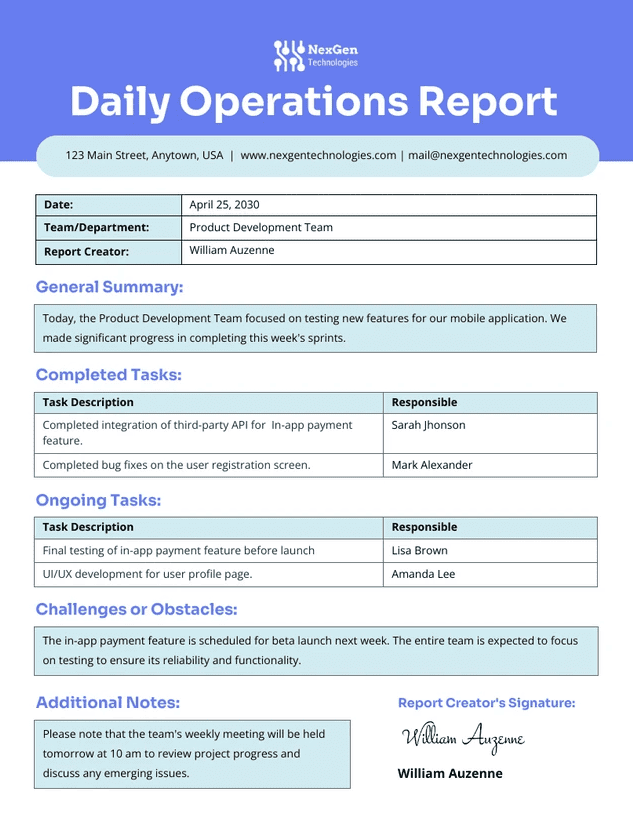
These types of reports will have routine updates that show how well the business is running over time.
- Daily Reports: Focus on immediate tasks like production output or sales made each day.
- Weekly Reports: Summarize patterns from daily reports, helping managers adjust for short-term goals.
- Monthly Reports: Provide a big-picture view of trends and overall performance, setting the tone for strategic planning.
Drill-down Reports
Leverage drill-down reports to dig deeper into specific metrics or areas of concern. Usually, this type of business operation report will —
- This will allow managers to move from a broad view to the fine details, such as breaking down revenue by region or product.
- Prove ideal for spotting where improvements are needed without losing context.
Ad hoc Reports
Ad hoc reports answer specific, one-time questions without following a predefined format. Creating such business operation reports can help in the following ways.
- They help analyze the impact of a recent campaign or a sudden change in market conditions.
- Highly flexible and tailored to the immediate issue, which is why it is often used to support fast decision-making.
Exception Reports
Exception reports highlight what isn’t working as expected so that you can align the business expectations.
- Instead of tracking everything, they focus on deviations, like delays in delivery or unusually high expenses.
- These reports are invaluable for identifying problems quickly and fixing them before they grow.
Analytical Reporting vs Operational Reporting
Both analytical and operational reporting have a huge role to play when it comes to leveraging business intelligence.
On the one hand, you have operational reporting, which focuses on real-time data for day-to-day decision-making. On the other hand, there’s analytical reporting, which dives deep into trends and patterns for long-term planning.
Here’s a quick comparison to help you understand their differences:
| Aspect | Operational Reporting | Analytical Reporting |
Purpose |
Tracks real-time data for immediate actions. |
Analyzes historical data to identify trends and support strategy. |
Timeframe |
Focused on the present or short-term activities. |
Oriented towards the past and long-term insights. |
Data Type |
Raw, transactional data (e.g., sales numbers, production metrics). |
Processed and aggregated data (e.g., revenue growth, customer behavior). |
Frequency |
Generated frequently (daily, weekly, or in real-time). |
Created less often (monthly, quarterly, or as needed). |
Audience |
Operational teams, frontline managers. |
Executives, analysts, and strategy planners. |
Format |
Simple and direct (tables, graphs, or dashboards). |
Detailed and complex (predictive models, deep insights). |
Goal |
Improve efficiency and resolve immediate issues. |
Drive long-term decisions and strategic growth. |
Tools |
Operational dashboards, transactional systems. |
Business intelligence tools and data visualization software. |
Benefits of Using Business Operations Reporting
With business operations reporting, your company can avail itself of a clear, actionable view of its daily tasks and processes. Use operational reporting so that the managers can track progress, identify bottlenecks, and make decisions backed by real-time data.
Below, we’ll be exploring some of the major benefits of business operations reporting for your organization.
Real-Time Decision-Making
Operational reports offer up-to-the-minute insights, which managers can use to act quickly when issues arise. This will help minimize downtime and keep workflows smooth.
Enhanced Productivity
Monitor performance metrics regularly so that teams can pinpoint inefficiencies and adjust strategies to improve output. This will ensure that every resource is used effectively.
Better Resource Allocation
Business operations reporting can highlight how resources like manpower, inventory, or finances are being utilized. With this, you can allocate them more wisely to avoid waste or shortages.
Increased Accountability
With detailed operational reporting, responsibilities are clearly tracked. It will create transparency and encourage team members to meet performance goals.
Early Detection of Problems
Reports can flag issues — such as delayed shipments, inventory shortages, or high costs — before they escalate so that businesses get enough time to implement fixes.
Data-Driven Insights for Strategy
While focused on daily tasks, operational reporting also contributes to strategic decision-making by showing patterns in key performance indicators over time.
Compliance and Audit Readiness
Consistent tracking of operations ensures that businesses maintain records that meet regulatory standards, simplifying audits and compliance processes.
FAQs on Business Operations Reporting
Below, we’re answering some common questions readers might have about business operations reporting, answered clearly to remove any confusion.
What is the purpose of a business operations report?
A business operations report tracks and analyzes key activities in an organization. Its purpose is to provide real-time insights into performance, highlight issues, and support decision-making for better outcomes.
How often should operational reports be created?
Operational reports can be created daily, weekly, or monthly, depending on the business’s needs. Daily reports focus on immediate tasks, while weekly and monthly reports offer a broader view of trends and performance.
What’s the difference between operational reporting and management reporting?
Operational reporting focuses on real-time data for day-to-day activities, while management reporting analyzes trends and performance over time to support strategic decisions.
Who benefits the most from operational reporting?
Managers, team leaders, and operational staff benefit the most as it helps them track progress, identify problems, and optimize daily workflows.
What kind of data is included in operational reports?
These reports include metrics such as production numbers, sales figures, resource usage, customer service stats, and any other data relevant to daily business activities.
How can templates help in creating operational reports?
Templates simplify the reporting process by providing a predefined structure. It’s one of the ways to save time, reduce errors, and ensure consistency across reports.
Can operational reports be automated?
Yes, many tools and software solutions allow automation of operational reports, reducing manual effort and delivering real-time data directly to dashboards or email.
Are operational reports industry-specific?
While the basic structure of operational reports can be similar across industries, the specific metrics and data tracked will vary depending on the business’s nature, such as manufacturing, retail, or services.
Can small businesses benefit from operational reporting?
Absolutely. Operational reporting isn’t just for large companies. Small businesses can use it to monitor cash flow, inventory, and customer satisfaction, helping them stay competitive and grow sustainably.
What tools are commonly used for operational reporting?
Businesses often use tools like Microsoft Power BI, Tableau, Google Data Studio, or Excel for operational reporting. These tools help visualize data and make it easier to track performance metrics in real time.

